InBetween States [Sound, Process, Notation]
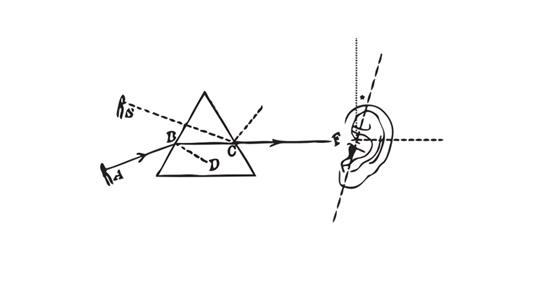
“Varying combination of sounds and “non-sounds” (silence) through time, sounding forms (Eduard Hanslick), time length pieces (John Cage). These definitions of music are referring to both a concrete and a non physical presence that are holding the vision of a special space-time constellation. The process of investigating the distribution of sounds is leading us to the magical state of the musical thought. Waiting, along the observation procedure are constructing an extension of the listeners traditional relationship with music.
What states might a musical thought have? How does interpretation is taking part in the process? How does representation affected? What are the bases of the musical experience? The exhibition is seeking to find these “in-between” states through the works of the New Music Studio , and students of Faculty of Music and Visual Arts University of Pécs and - of course - the presence of the visitors.” (from the exhibition catalogue)
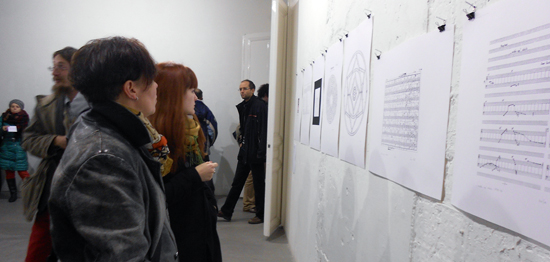
Exhibition Space (2B Gallery)
New Music Studio is a group of musicians formed in the seventies in Budapest. They were focusing on some kind of methodology and philosophy of the contemporary music scene that was different from the canonized mainstream. They brought “cageian” influences and the legacy of fluxus to the regions of eastern european society. The main founders of the group ( Laszlo Sary, Laszlo Vidovszky,Zoltan Jeney, Peter Eötvös, Zoltán Kocsis, András Wilheim et al) amongst other creative minds produced several interesting pieces that were questioning traditional musical interpretation methods, notation, performance and the articulation of musical expressions. Their legacy is hard to interpret hence the large amount of their pieces. These neither fit in the traditional performative space, also difficult to adjust to gallery spaces.
The exhibition is a truly great reflection to this situation: installations, homage works and cross references are introduced to the audience in order to shed light on most of these problematic aspects. The tribute works of the next generation are also deeply experimental and fresh pieces that are using post digital concepts the aesthetics of raw, ubiquitous, programmable electronics where people can focus on content and aural space instead of regular computers and the like. The presented spatial sound installations find their place perfectly in the gallery space. The collected documents and visual landmarks of the exhibition are giving hints on very interesting topics without the need for completeness which is a good starting point to dive into this world deeper. The exhibition is curated by Reka Majsai.
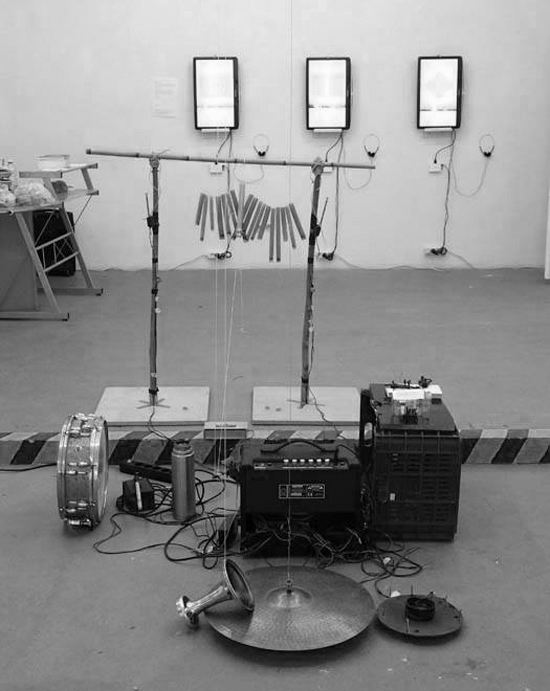
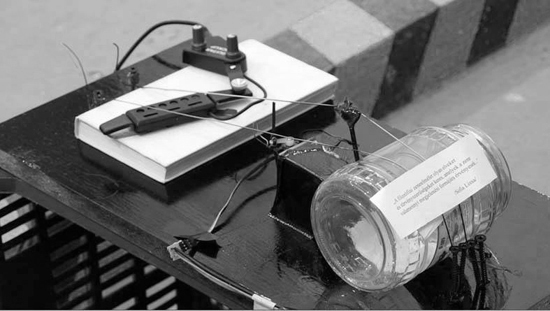
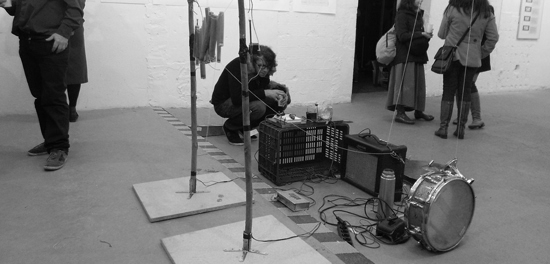
Hommage á Autoconcert (Balázs Kovács & students from University of Pécs)
“Hommage á Autoconcert” by Balazs Kovacs (xrc) [link] & students from the University of Pécs is a sound installation that is constructed of several found objects and instruments. It is a tribute to the so called “Autoconcert” (1972) by Laszlo Vidovszky. The original piece has a diverse set of found objects that are falling from above over different time intervals during the performance. The present installation is dealing with the sound events in a reproducible way: the objects are not falling, but get hit by small sticks from time to time. These events are constructing a balanced aural space where some tiny noise, amplified strings and colliding cymbals can be heard as some acoustic background layer. The sticks are moved by little servo motors, the logic is controlled by a few arduino boards .
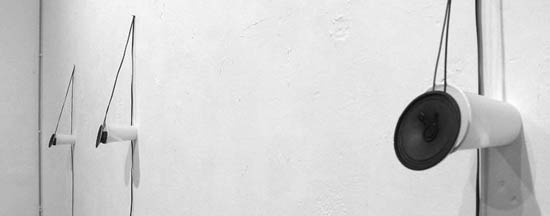
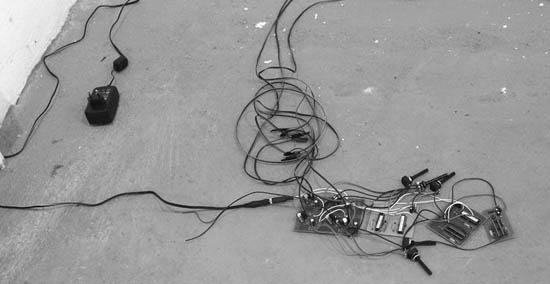
Repeating and overlapping of three musical processes (Gábor Lázár)
“Repeating and overlapping of three musical processes” by Gábor Lázár is also a sound installation made with custom micro controllers and three speakers set in plastic glasses as acoustic resonators. The processes are based on ever-changing time manipulations between musical trigger events. Dividing time within these in-between temporal events cause ever-increasing pitch shifting in the auditory field. The overall sound architecture forms a very saturated and diverse experience.
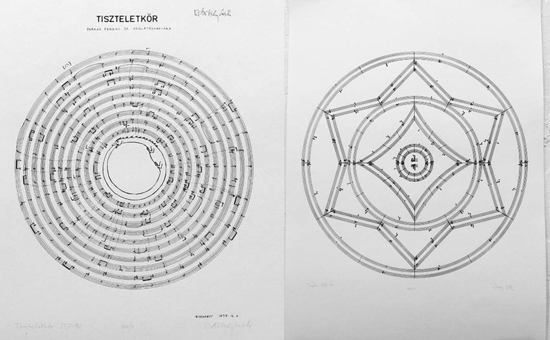
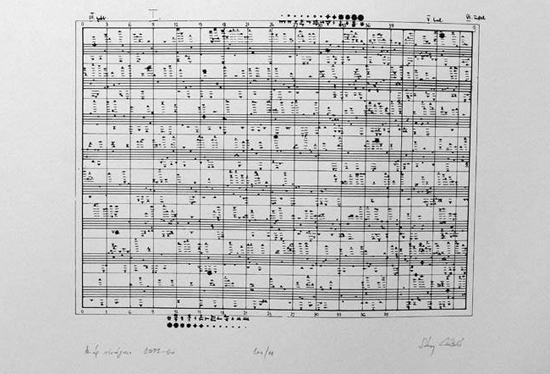
Visual Notations (New Music Studio)
“Visual Notations” by the New Music Studio members themselves are in fact several notation pieces crafted in a beautiful way. Varying nonstandard notation techniques are introduced here: using the graphical alignment of stellar constellations (Flowers of heaven, Sary), spiral like, self-eating dragon (Lap of honour, Vidovszky), ancient hindu symbols (Yantra, Jeney) are all taking part in the semantics and development in these sounding images.
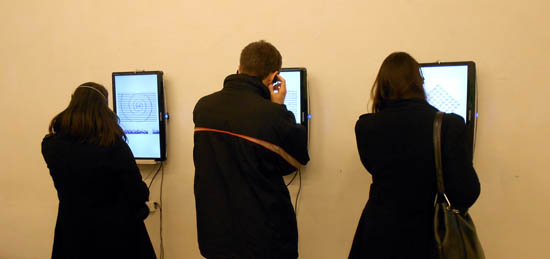
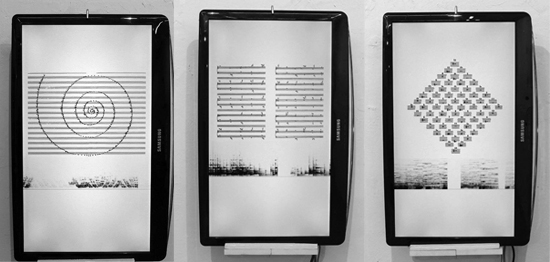
Three pieces by Sáry (reinterpretation & software by Agoston Nagy)
There is also an installation I’ve been involved with: interpreting three pieces by Laszlo Sary. The triptych is letting the observer see and hear the inner sound structures at the same time. The upper region of the screen is displaying the original notation, this can be referred to the piece as a spatial constellation of the sounds to be played. Each work has different notations and different instructions on how to play the notes. The bottom region is displaying a live spectrogram of the actual sound. This is showing a temporal distribution of the events which has different characteristics with each piece.
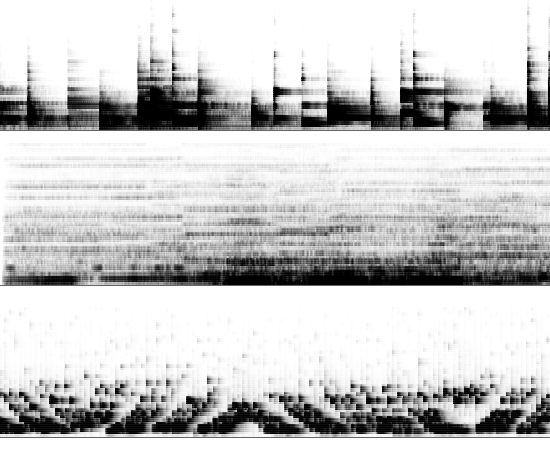
Musical Spectra of the three different pieces by Sáry
“Sunflower” (1989, based on Snail Play, 1975) has a spiral-like spatial distribution in the sheet, these patterns are clearly visible in the musical spectra: infinite ladders are running up and down as the musicians are playing on three percussive marimbas. “Sounds for” (1972) is based on some predefined notes that can be accessed by the performer in any order they prefer. Larger, distant, sudden triggers are defining a more strict, cityscape-like spectra. The final piece, “Full Moon” (1986) is based on a permutation procedure [link]: the individual notes are played back simultaneously by four (or more) musicians at the same time. Their individual routes are defining the final constellation of sounds. The visible spectra is like a continuous flow, where soft pitch intonations are in focus against the previous two, rhythm oriented works. The setup is made with free & open source tools, using OpenFrameworks on three raspberry pi boards.
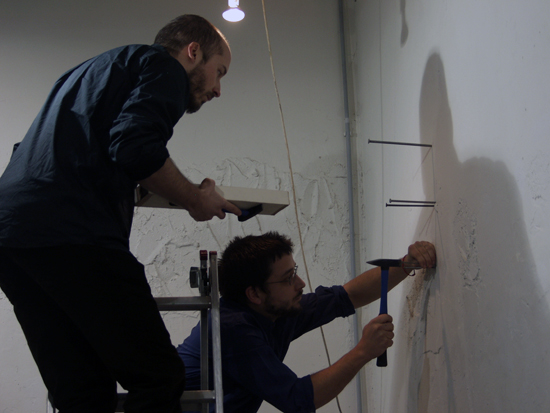
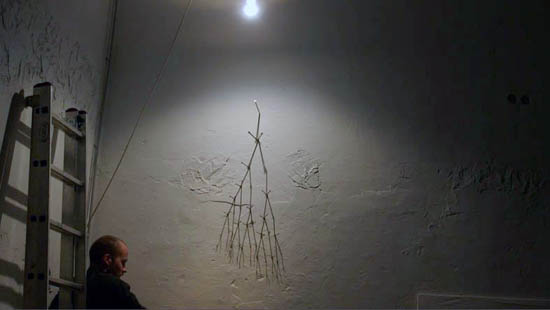
Images of the exhibition opening
It is hard to describe all the aspects of the exhibited works and the legacy of the New Music Studio, as their works had many local influences in the East European region at their time. The states of “in-between-ness” however are clearly recognizable on several layers of the whole event: the political and cultural influences of the original artists, the continuous phase shift between the musical and the visual domain, the tribute works where the creators are halfway in-between authors and interpreters. The exhibition is all together a really important summary of a niche cultural landmark in the Hungarian and international contemporary music scene.
Thanks for Gabor Toth for the photos.
Javascript Sound Experiments - Spectrum Visualization [ProcessingJS + WebAudio]
This entry is just a quick add-on for my ongoing sound related project that maybe worth sharing. I came up with the need of visualizing sound spectrum. You might find a dozen of tutorials on the topic, but I didn’t think that it is so easy to do with processingJS & Chrome’s WebAudio Api. I found a brilliant and simple guide on the web audio analyser node here . This is about to make the visuals with native canvas animation technique. I used the few functions from this tutorial and made a processingJS port of it. The structure of the system is similar to my previous post on filtering:
1. Load & playback the sound file with AudioContext (javascript)
2. Use a function to bridge native javascript to processingJS (pass the spectrum data as an array)
3. Visualize the result on the canvas
Load & playback the sound file with AudioContext (javascript)
We are using a simpler version of audio cooking within this session compared to the previous post. The SoundManager.js file simply prepares our audio context, loads and plays the specified sound file once the following functions are called:
initSounds();
startSound('ShortWave.mp3');
We call these functions when the document is loaded. That is all about sound playback, now we have the raw audio data in the speakers, let’s analyze it.
Use a function to bridge native javascript to processingJS
There is a function to pass the spectrum data as an array, placed in the head section of our index.html:
function getSpektra()
                 {
                      // New typed array for the raw frequency data
                  var freqData = new Uint8Array(analyser.frequencyBinCount);

                  // Put the raw frequency into the newly created array
                  analyser.getByteFrequencyData(freqData);
                  var pjs = Processing.getInstanceById('Spectrum');
                  if(pjs!=null)
                   {
                           pjs.drawSpektra(freqData);
                      }
                 }
This function is based on the built-in analyzer that can be used with the WebAudio API. the “freqData” object is an array that will contain all the spectral information we need (1024 spectral bins by default) to be used later on. To find out more on the background of spectrum analysis, such as Fourier transformation, spectral bins, and other spectrum-related terms, Wikipedia has a brief introduction.
However we don’t need to know too much about the detailed backgrounds. In our array, the numbers are representing the energy of the sounds from the lowest pitch to the highest pitch in 1024 discrete steps, all the time we call this function (it is a linear spectral distribution by default). We use this array and pass to our processing sketch within the getSpectra() function.
Visualize the result on the canvas
From within the processing code, we can call this method any time we need. We just have to create a JavaScript interface to be able to call any function outside of our sketch (as shown in the previous post, also):
interface JavaScript
{
  void getSpektra();
}

//  make the connection (passing as the parameter) with javascript
void bindJavascript(JavaScript js)
{
  javascript = js;
}

//  instantiate javascript interface
JavaScript javascript;
That is all. Now we can use our array that contains all the spectral information by calling the getSpectra() function from our sketch:
//     error checking
    if(javascript!=null)
    {
      //  control function for sound analysis
      javascript.getSpektra();
    }
We do it in the draw function. The getSpectra() is passing the array to processing in every frame, so we can create our realtime visualization:
//     function to use the analyzed array
void drawSpektra(int[] sp)
{
     //     your nice visualization comes here...
     fill(0);
       for (int i=0; i<sp.length; i++)
       {
         rect(i,height-30,width/sp.length,-sp[i]/2);
       }
}
As usual, you can download the whole source code from here as well as try out before using it with the live demo here. Please note, the demo currently works with the latest stable version of Google Chrome.
Sand Experiments
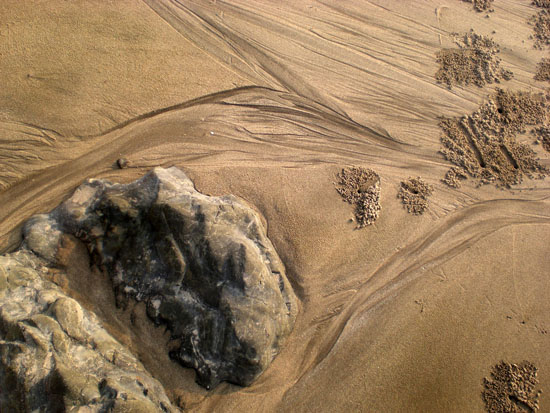
The last few weeks I was out of the circles & routines of my regular life, did not use my ordinary tools, I was visiting and contemplating different reality concepts during my journey in the far east. Self confidence, clean associations, purity arise without the regular routines that are wired so deep in me. To avoid regular routines: I travelled far and was doing something else.
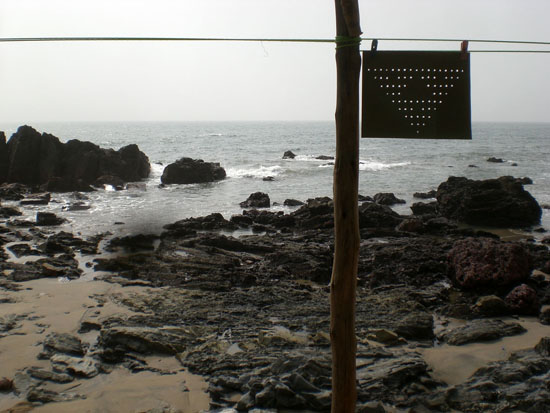
Some days I was playing with sand. I saw some crabs digging holes into the sand to avoid attacks on the beach. They left really interesting patterns on the sand. I started cutting holes into a cardboard, pouring sand onto the surface of it, then observing the naturally organized patterns that are exactly the same that we find in the -these days so overhyped- algorithms of voronoi tessellations and diagrams.
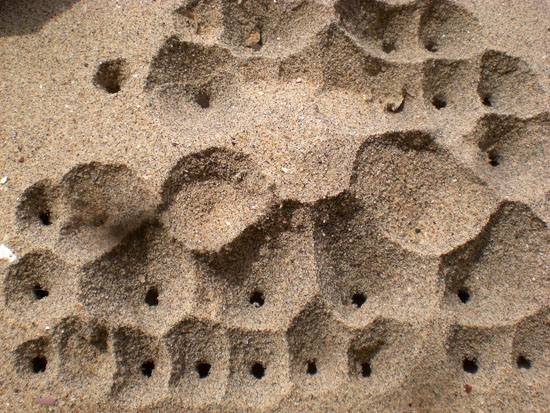
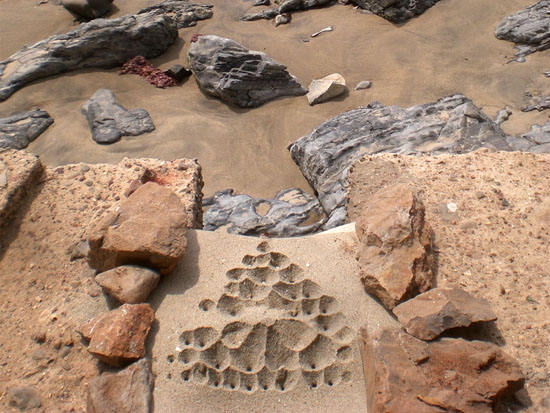
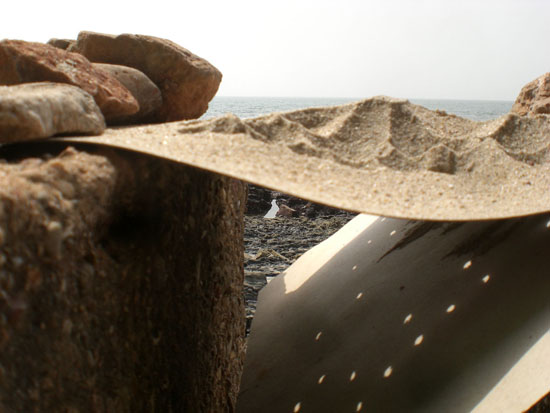
After all it is really interesting that some basic computational calculations can be done with some natural forces (gravity and density in this case). Take time for example: sandglass is one of the simplest exact visualizations of time that we can find in nature.
The other example is a visible process instead of a “compiled” result. The sand is dancing here. It is in continuous movement, an ever-cycling entity, acts like a liquid, morphing shapes of mountains and oceans become visible between the interaction of the grains. It is a sort of low-tech reaction diffusion system. These methods are also used so widely in the world of computer graphics as natural simulations. The system here consists of sand, oscillating air pressure and gravity: a speaker is placed under the surface that is resonating at 60Hz.
pure data workshop @ kitchen budapest
algorithm: logic + control
