SlitScan_JS [Webcam, ProcessingJS]
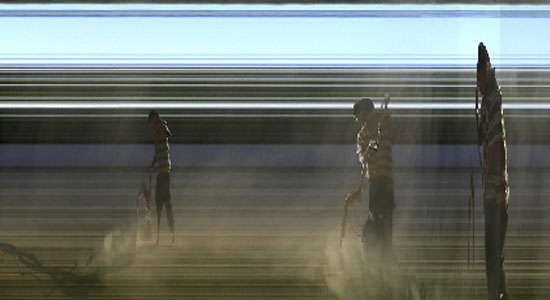
Slitscan, or “slit-scan photography” refers to cameras that use a slit, which is particularly used in scanning cameras in panoramic photography. It has many implementations with different hardware & software languages among many artistic and technological contexts. As I am currently working on a project that is involved some aspects of this technique (but extended into something totally unusual and strange, bit more about it later…), I just hooked together a quick hack of the recently introduced media API for users webcam and microphones and combine it with processingjs to make life easier.
In fact the getUserMedia() query can be used in a lot wider context than only within this example. Since we can access all pixels within the live video feed using javascript, it is becoming lot easier to build motion tracking, color tracking and other computer vision based sensing technologies for plugin free, open web based applications. Here it is a really simple example which is calling the loadPixels() function of processing so each pixel can be set and replaced within the image. As a simple result we are placing ellipses with the corresponding color values of the pixels on the screen.
You can try out the working demo (tested & working with Google Chrome)
Grab the source from Github
PolySample [Pure Data]
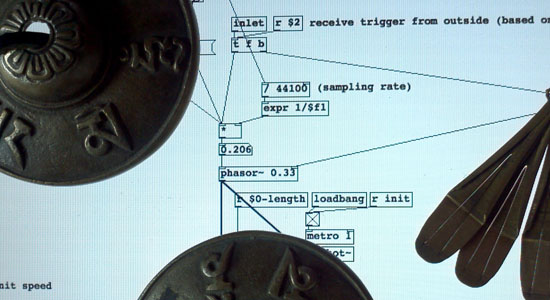
I’ve been involved in a few projects recently where simultaneous multiple sound playback was needed. Working in the projects Syntonyms ( with Abris Gryllus and Marton Andras Juhasz ), SphereTones ( with Binaura ), and No Distance No Contact ( with Szovetseg39 ) repeatedly brought me the concept of playing overlapping sound samples. This means when you need to playback a sample and start playing it back again, before the previous instance has been finished. The Pure Data musical environment is really useful for low level sound manipulation, can be tweaked towards specific directions. I was searching the web for some solutions, but still didn’t find a really simple polyphonic sound sampler with adjustable pitch that is capable to play back multiple instances of the same sound if needed. For instance if you need to play long, resonating, vibrating sounds, it is useful to let the playback of the previous one finishing, so the next sound doesn’t interrupt it, but there are two instances of the same sound, both of them left decaying smooth & clear. Like raindrops or percussions, etc.
As a starting point I found myself again in the territories of dynamic patching. As you see on the video ( which is an older pd experiment of mine ) there are things that can be left to pd itself. Creating, deleting, connecting objects can be done quite easily by sending messages to pd itself. With PolySample, once the user creates a [createpoly] object, it automatically creates several samplers in itself. The number of generated samplers can be given as a second argument to the object. First argument is the name of the sound file to be played back. There is an optional third argument for changing the sampling rate ( which is 44100 by default ). It is useful when working with libPd and the like, where different devices and tablets operate on a lower sampling rate. So creating a sampler can be invoked as
[ createPoly < sound filename > < numberOfPolyphony > < sample rate > ]
The first inlet of the object accepts a list: the first element is the pitch, the second element is the volume of the actual sample to be played. This is useful when trying to mimic string instruments or really dynamic range of samples. This volume sets the initial volume of each sample ( within the polyphony ), whereas the second inlet accepts a float for controlling the overall sound, as a mixer.
You can create as many polyphonic samplers as you wish ( keep in mind that smaller processors can be freaked out quite quickly if you create tons of sample buffers at the same time ). The project is available at Github, here.
Built with Pd Vanilla, should work with libPd, webPd, RJDJ and other embeddable Pd projects.
Javascript Sound Experiments - Spectrum Visualization [ProcessingJS + WebAudio]
This entry is just a quick add-on for my ongoing sound related project that maybe worth sharing. I came up with the need of visualizing sound spectrum. You might find a dozen of tutorials on the topic, but I didn’t think that it is so easy to do with processingJS & Chrome’s WebAudio Api. I found a brilliant and simple guide on the web audio analyser node here . This is about to make the visuals with native canvas animation technique. I used the few functions from this tutorial and made a processingJS port of it. The structure of the system is similar to my previous post on filtering:
1. Load & playback the sound file with AudioContext (javascript)
2. Use a function to bridge native javascript to processingJS (pass the spectrum data as an array)
3. Visualize the result on the canvas
Load & playback the sound file with AudioContext (javascript)
We are using a simpler version of audio cooking within this session compared to the previous post. The SoundManager.js file simply prepares our audio context, loads and plays the specified sound file once the following functions are called:
initSounds();
startSound('ShortWave.mp3');
We call these functions when the document is loaded. That is all about sound playback, now we have the raw audio data in the speakers, let’s analyze it.
Use a function to bridge native javascript to processingJS
There is a function to pass the spectrum data as an array, placed in the head section of our index.html:
function getSpektra()
                 {
                      // New typed array for the raw frequency data
                  var freqData = new Uint8Array(analyser.frequencyBinCount);

                  // Put the raw frequency into the newly created array
                  analyser.getByteFrequencyData(freqData);
                  var pjs = Processing.getInstanceById('Spectrum');
                  if(pjs!=null)
                   {
                           pjs.drawSpektra(freqData);
                      }
                 }
This function is based on the built-in analyzer that can be used with the WebAudio API. the “freqData” object is an array that will contain all the spectral information we need (1024 spectral bins by default) to be used later on. To find out more on the background of spectrum analysis, such as Fourier transformation, spectral bins, and other spectrum-related terms, Wikipedia has a brief introduction.
However we don’t need to know too much about the detailed backgrounds. In our array, the numbers are representing the energy of the sounds from the lowest pitch to the highest pitch in 1024 discrete steps, all the time we call this function (it is a linear spectral distribution by default). We use this array and pass to our processing sketch within the getSpectra() function.
Visualize the result on the canvas
From within the processing code, we can call this method any time we need. We just have to create a JavaScript interface to be able to call any function outside of our sketch (as shown in the previous post, also):
interface JavaScript
{
  void getSpektra();
}

//  make the connection (passing as the parameter) with javascript
void bindJavascript(JavaScript js)
{
  javascript = js;
}

//  instantiate javascript interface
JavaScript javascript;
That is all. Now we can use our array that contains all the spectral information by calling the getSpectra() function from our sketch:
//     error checking
    if(javascript!=null)
    {
      //  control function for sound analysis
      javascript.getSpektra();
    }
We do it in the draw function. The getSpectra() is passing the array to processing in every frame, so we can create our realtime visualization:
//     function to use the analyzed array
void drawSpektra(int[] sp)
{
     //     your nice visualization comes here...
     fill(0);
       for (int i=0; i<sp.length; i++)
       {
         rect(i,height-30,width/sp.length,-sp[i]/2);
       }
}
As usual, you can download the whole source code from here as well as try out before using it with the live demo here. Please note, the demo currently works with the latest stable version of Google Chrome.
Javascript Sound Experiments - Filtering [ProcessingJS + WebAudio]
I am working on a sound installation project where we are building our custom devices to measure distance (using wireless radiofrequency technology) & create sounds (using DAC integrated circuits with SD card storage, connected to a custom built analogue filter modul) through simple electronic devices. The building of the hardware with Marton Andras Juhasz is really exciting and inspirative in itself, not to mention the conceptual framework of the whole project. More hardware related details are coming soon, the current state is indicated on the video below:
The scope of this entry is about to represent filtered audio online, natively in the browser. I have to build an online representation of the system where the analog hardware modules can be seen and tried out within a simplified visualization (that is mainly to indicate the distances between the nodes in the system). Apart from the visualization, sound is playing a key role in the online representation, so I started playing with the Web Audio API , where a simple sound playback can be extended with filtering, effecting using audio graphs. The state of web audio might seem a bit confusing at the moment (support, browsers compatibility etc). To minimize confusion, you can read more about the Web Audio API here.One is for sure: the context of web audio is controlled via JavaScript, so it can fit well into any project that is using high level JavaScript drawing libraries, such as ProcessingJS.
The basic structure that we do here is
1. Load & playback soundfiles
2. Display information, create visual interface
3. Use control data from the interface and drive the parameters of the sounds
Load & Playback soundfiles
I found a really interesting collection of web audio resources here that are dealing with asynchronous loading of audio, preparing their content for further processing by storing them in buffers. Sound loading and storing in buffers is all handled with the attached Javascript files. If you need to switch sounds later, you can do it asynchronuously by calling the loadBufferForSource(source to load, filename) anytime anywhere on your page.
Display Information, create visual interface
Connecting your processingjs sketch to the website can be done by following this excellent tutorial. You should make functions in your Javascript that are “listening” to processingjs events. You can call any function that can accept any parameters. One important thing is that you have to actually connect the two systems by instantiating a processingjs object as the following snippet shows:
var bound = false;
function bindJavascript()
{
    var pjs = Processing.getInstanceById('c');
    if(pjs!=null)
    {
      pjs.bindJavascript(this);
      bound = true;
    }
    if(!bound) setTimeout(bindJavascript, 250);
  }

  bindJavascript();
We have some work to do in the processingjs side, also:
//  create javascript interface for communication with functions that are "outside"
//  of processingjs

interface JavaScript
{
     void getPointerValues(float x, float y);
  void getFilterValues(float filter1, float filter2);
  void getGainValues(float gain1, float gain2);
}

//  make the connection (passing as the parameter) with javascript
void bindJavascript(JavaScript js)
{
     javascript = js;
}

//  instantiate javascript interface
JavaScript javascript;
Use control data from the interface and drive the parameters of the sounds
After connecting the html page with our sketch it is possible to use any action in the sketch to control our previously loaded sounds. This way we separate the whole audio engine (handling, storing, etc) from the visual interface (the processingjs canvas with rich interactive contents) by linking the two with a few functions to pass some parameters. These binding functions might remind someone to the OSC way of connecting of two softwares where functionalities are staying clearly isolated within the different systems, only the parameters are traveling between them represented as numbers, labels or other types of symbols.
This example at the moment works only with Chrome (new stable releases). According to the developer docs it should work with the new Safari (WebKit) browser but I couldn’t make it. Hope this will be fixed soon…
Try out the LIVE DEMO (you need latest stable Google Chrome
)
Download full source code (zip) from here
Sand Experiments
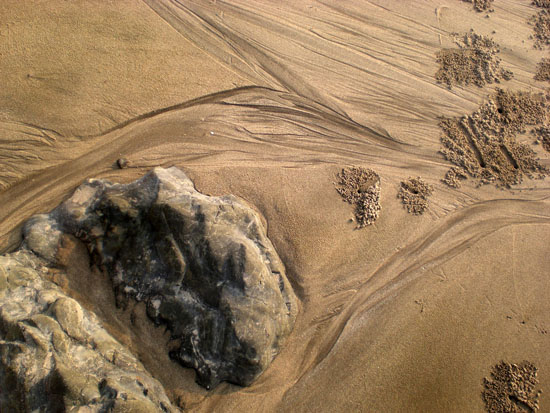
The last few weeks I was out of the circles & routines of my regular life, did not use my ordinary tools, I was visiting and contemplating different reality concepts during my journey in the far east. Self confidence, clean associations, purity arise without the regular routines that are wired so deep in me. To avoid regular routines: I travelled far and was doing something else.
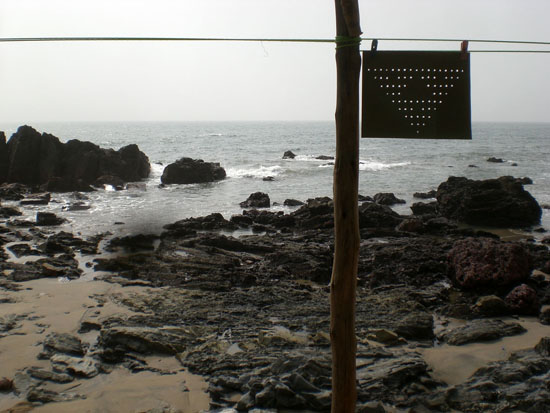
Some days I was playing with sand. I saw some crabs digging holes into the sand to avoid attacks on the beach. They left really interesting patterns on the sand. I started cutting holes into a cardboard, pouring sand onto the surface of it, then observing the naturally organized patterns that are exactly the same that we find in the -these days so overhyped- algorithms of voronoi tessellations and diagrams.
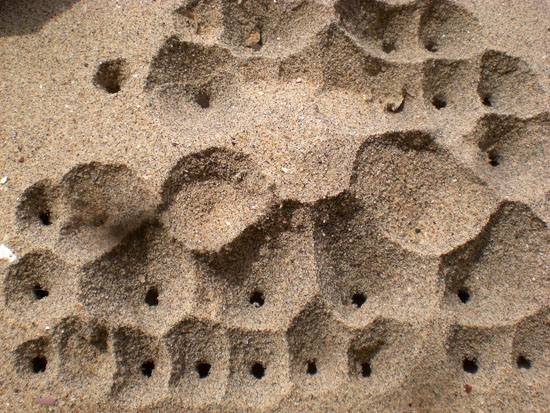
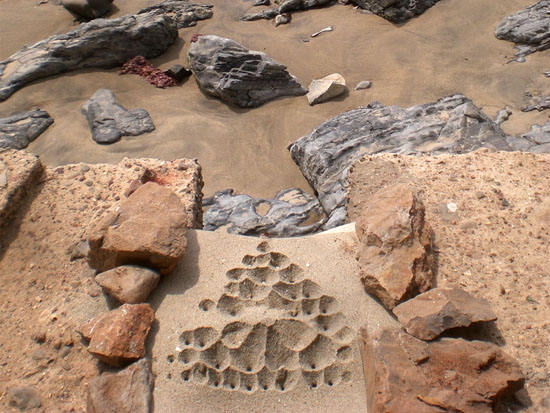
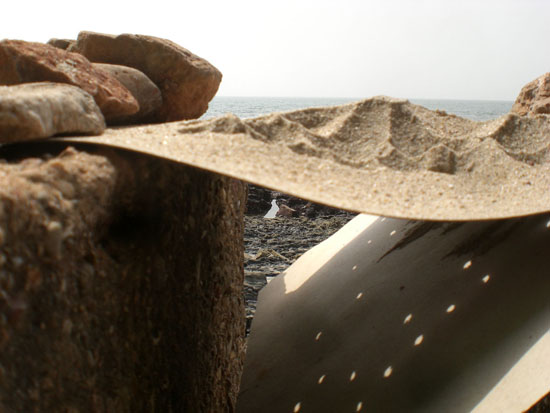
After all it is really interesting that some basic computational calculations can be done with some natural forces (gravity and density in this case). Take time for example: sandglass is one of the simplest exact visualizations of time that we can find in nature.
The other example is a visible process instead of a “compiled” result. The sand is dancing here. It is in continuous movement, an ever-cycling entity, acts like a liquid, morphing shapes of mountains and oceans become visible between the interaction of the grains. It is a sort of low-tech reaction diffusion system. These methods are also used so widely in the world of computer graphics as natural simulations. The system here consists of sand, oscillating air pressure and gravity: a speaker is placed under the surface that is resonating at 60Hz.
